Official rows
—
Deduplicated inside the declared AOI
Waiting for verified spatial branches.
Magnitude type, value, depth, location, intensity, and source remain specific to each final PHIVOLCS bulletin. Preliminary and USGS values are not silently merged.
| Time · PHT | Final magnitude | Depth | Final location | Max intensity | Source |
|---|
1,202 deduplicated public bulletin rows inside the declared research AOI: the directly reviewed June 8 mainshock anchor plus continuous capture from June 30 through the partial July 22 snapshot. June 9–29 remains an explicit no-data gap. AOI inclusion is not an official associated-aftershock flag.
| Time · PHT | Magnitude | Depth | Research branch | PHIVOLCS location | Source |
|---|
| Source | Report Time | Context | Relation | Outcome | Status |
|---|---|---|---|---|---|
| FELTLocal felt · low certainty · pending official check | Jun 10 · by ~09:55 AM | 09:13 AM extended-phase watch | Earlier / uncertain | Significant felt activity | Pending PHIVOLCS |
| OBSLocal outcome · no-shake · not official | Jun 10 · 02:03 PM | 7.0× long-phase watch | Watch center elapsed | No local outcome observed | Elapsed |
| OBSLocal outcome · no-shake · not official | Jun 10 · 03:32 PM | 9.5× extended-phase watch | Watch center elapsed | No local outcome observed | Elapsed |
| FELTLocal felt-only · low certainty · pattern context | Jun 10 · ~05:14 PM | 05:37 PM phase-sensitive watch | Before the watch time; ~23 min before anchor | Brief local shake felt | Felt-only |
| FELTLocal felt-only · low certainty · pattern context | Jun 10 · ~07:36 PM | 07:41 PM 7.0× long-phase watch | Before the watch time; ~5 min before anchor | Subtle local movement felt for ~1 min | Felt-only |
| OBSLocal outcome · no-shake · not official | Jun 10 · 09:10 PM | 9.5× extended-phase watch | Nothing happened during the watch | No local shake observed | Elapsed |
| FELTLocal felt-only · low certainty · anchor candidate | Jun 10 · ~11:47 PM | 3.5× phase-sensitive watch | After the watch time; ~32 min after anchor | Subtle local movement noticed for brief | Felt-only |
| OBSLocal outcome · no-shake · not official | Jun 11 · 12:54 PM | 9.5× extended-phase watch | Nothing happened during the watch | No local shake observed through the morning after the final watch | Elapsed |
| FELTLocal felt-only · low certainty · pattern context | Jun 11 · ~03:34 PM | 3.5× phase-sensitive watch | After the watch time; ~36 min after anchor | Local shake noticed underneath around 03:34 PM for brief | Felt-only |
| OBSLocal outcome · no-shake · not official | Jun 11 · 09:11 PM | 9.5× extended-phase watch | Nothing happened during the watch | No observation report for now; no local shake observed during the watch | Elapsed |
| OBSLocal outcome · no-shake · not official | Jun 11 · 09:46 PM | 1.0× post-anchor watch | Nothing happened during the watch | No local shake observed during the elapsed watch | Elapsed |
| OBSLocal outcome · no-shake · not official | Jun 12 · 01:54 AM | 7.0× long-phase watch | Nothing happened during the watch | No local shake observed during the elapsed watch | Elapsed |
| OBSLocal outcome · no-shake · not official | Jun 12 · 07:31 AM | 9.5× extended-phase watch | Nothing happened during the watch | No local observation around the four elapsed observation windows | Elapsed |
| OBSLocal outcome · no-shake · not official | Jun 12 · 01:08 PM | 9.5× extended-phase watch | Nothing happened during the watch | No local observation around the four elapsed observation windows | Elapsed |
| FELTLocal felt-only · low certainty · pattern context | Jun 13 · ~01:24 AM | 9.5× extended-phase watch | After the watch time; ~398 min after anchor | Consistent subtle local shake felt by observer; felt-only local observation, not an official seismic confirmation | Felt-only |
| FELTLocal felt-only · low certainty · pattern context | Jun 13 · ~10:07 AM | 9.5× extended-phase watch | After the watch time; ~185 min after anchor | Clear local shake felt by observer around 10:07 AM; felt-only local observation, not an official seismic confirmation | Felt-only |
| OBSLocal outcome · no-shake · not official | Jun 13 · 03:44 PM | 9.5× extended-phase watch | Nothing happened during the watch | All prior windows elapsed; no new local shake reported | Elapsed |
| FELTLocal felt-only · low certainty · pattern context | Jun 14 · ~07:30 AM | 9.5× extended-phase watch | After the watch time; ~608 min after anchor | Subtle local shake felt by observer around 7:30 AM; felt-only local observation, not an official seismic confirmation | Felt-only |
| OBSLocal outcome · no-shake · not official | Jun 14 · 01:07 PM | 9.5× extended-phase watch | Nothing happened during the watch | All prior windows elapsed; no new local shake reported | Elapsed |
| OBSLocal outcome · no-shake · not official | Jun 14 · 06:45 PM | 9.5× extended-phase watch | Nothing happened during the watch | All prior windows elapsed; no new local shake reported | Elapsed |
| OBSLocal outcome · no-shake · not official | Jun 15 · 12:23 AM | 9.5× extended-phase watch | Nothing happened during the watch | All prior windows elapsed; no new local shake reported | Elapsed |
| OBSLocal outcome · no-shake · not official | Jun 15 · 06:00 AM | 9.5× extended-phase watch | Nothing happened during the watch | All prior windows elapsed; no new local shake reported | Elapsed |
| OBSLocal outcome · no-shake · not official | Jun 15 · 11:38 AM | 9.5× extended-phase watch | Nothing happened during the watch | All prior windows elapsed; no new local shake reported | Elapsed |
| FELTLocal felt-only · low certainty · pattern context | Jun 15 · ~05:20 PM | 9.5× extended-phase watch | Around the watch time | Strong local shake felt by observer around 5:20 PM for at least 6 seconds; subjectively closer to a 7.0×-or-less felt class; felt-only local observation, not an official seismic confirmation | Felt-only |
| OBSLocal outcome · no-shake · not official | Jun 15 · 10:57 PM | 9.5× extended-phase watch | Nothing happened during the watch | All prior windows elapsed; no new local shake reported | Elapsed |
| FELTLocal felt-only · low certainty · pattern context | Jun 15 · ~11:30 PM | 1.0× post-anchor watch | Around the watch time | Subtle local shake felt by observer around 11:30 PM, slightly before the 1.0× watch center; felt-only local observation, not an official seismic confirmation | Felt-only |
| OBSLocal outcome · no-shake · not official | Jun 16 · 05:07 AM | 9.5× extended-phase watch | Nothing happened during the watch | No local shake observed | Elapsed |
| OBSLocal outcome · no-shake · not official | Jun 16 · 01:35 PM | 9.5× extended-phase watch | Nothing happened during the watch | No local shake observed | Elapsed |
| OBSLocal outcome · no-shake · not official | Jun 16 · 07:12 PM | 9.5× extended-phase watch | Nothing happened during the watch | No local shake observed through the evening; all prior watches elapsed | Elapsed |
| OBSLocal outcome · no-shake · not official | Jun 17 · 12:49 AM | 9.5× extended-phase watch | Nothing happened during the watch | No local shake observed through the night; all watches elapsed | Elapsed |
| OBSLocal outcome · no-shake · not official | Jun 17 · 06:26 AM | 9.5× extended-phase watch | Nothing happened during the watch | No local shake observed through the early morning; all prior watches elapsed | Elapsed |
| OBSLocal outcome · no-shake · not official | Jun 17 · 07:01 AM | 1.0× post-anchor watch | Nothing happened during the watch | No local shake observed | Elapsed |
| OBSLocal outcome · no-shake · not official | Jun 17 · 08:30 AM | 3.5× phase-sensitive watch | Nothing happened during the watch | No local shake observed | Elapsed |
| OBSLocal outcome · no-shake · not official | Jun 17 · 10:34 AM | 7.0× long-phase watch | Nothing happened during the watch | No local shake observed | Elapsed |
| OBSLocal outcome · no-shake · not official | Jun 17 · 12:03 PM | 9.5× extended-phase watch | Nothing happened during the watch | No local shake observed through the midday; all prior watches elapsed | Elapsed |
| OBSLocal outcome · no-shake · not official | Jun 17 · 12:38 PM | 1.0× post-anchor watch | Nothing happened during the watch | No local shake observed | Elapsed |
| OBSLocal outcome · no-shake · not official | Jun 17 · 02:07 PM | 3.5× phase-sensitive watch | Nothing happened during the watch | No local shake observed | Elapsed |
| OBSLocal outcome · no-shake · not official | Jun 17 · 04:11 PM | 7.0× long-phase watch | Nothing happened during the watch | No local shake observed | Elapsed |
| OBSLocal outcome · no-shake · not official | Jun 17 · 05:40 PM | 9.5× extended-phase watch | Nothing happened during the watch | No local shake observed through the afternoon; all prior watches elapsed | Elapsed |
| OBSLocal outcome · no-shake · not official | Jun 17 · 06:16 PM | 1.0× post-anchor watch | Nothing happened during the watch | No local shake observed | Elapsed |
| OBSLocal outcome · no-shake · not official | Jun 17 · 07:45 PM | 3.5× phase-sensitive watch | Nothing happened during the watch | No local shake observed | Elapsed |
| OBSLocal outcome · no-shake · not official | Jun 17 · 09:49 PM | 7.0× long-phase watch | Nothing happened during the watch | No local shake observed | Elapsed |
| OBSLocal outcome · no-shake · not official | Jun 17 · 11:18 PM | 9.5× extended-phase watch | Nothing happened during the watch | No local shake observed through the evening; all prior watches elapsed | Elapsed |
| OBSLocal outcome · no-shake · not official | Jun 17 · 11:54 PM | 1.0× post-anchor watch | Nothing happened during the watch | No local shake observed | Elapsed |
| OBSLocal outcome · no-shake · not official | Jun 18 · 01:22 AM | 3.5× phase-sensitive watch | Nothing happened during the watch | No local shake observed | Elapsed |
| OBSLocal outcome · no-shake · not official | Jun 18 · 03:27 AM | 7.0× long-phase watch | Nothing happened during the watch | No local shake observed | Elapsed |
| OBSLocal outcome · no-shake · not official | Jun 18 · 04:55 AM | 9.5× extended-phase watch | Nothing happened during the watch | No local shake observed through the early morning; all prior watches elapsed | Elapsed |
| OBSLocal outcome · no-shake · not official | Jun 18 · 05:30 AM | 1.0× post-anchor watch | Nothing happened during the watch | No local shake observed | Elapsed |
| OBSLocal outcome · no-shake · not official | Jun 18 · 06:59 AM | 3.5× phase-sensitive watch | Nothing happened during the watch | No local shake observed | Elapsed |
| OBSLocal outcome · no-shake · not official | Jun 18 · 09:03 AM | 7.0× long-phase watch | Nothing happened during the watch | No local shake observed | Elapsed |
| OBSLocal outcome · no-shake · not official | Jun 18 · 10:32 AM | 9.5× extended-phase watch | Nothing happened during the watch | No local shake observed through the morning; all prior watches elapsed | Elapsed |
| OBSLocal outcome · no-shake · not official | Jun 18 · 11:07 AM | 1.0× post-anchor watch | Nothing happened during the watch | No local shake observed | Elapsed |
| OBSLocal outcome · no-shake · not official | Jun 18 · 12:36 PM | 3.5× phase-sensitive watch | Nothing happened during the watch | No local shake observed | Elapsed |
| FELTLocal felt-only · low certainty · pattern context | Jun 18 · ~02:58 PM | 7.0× long-phase watch | After the watch time; ~17 min after anchor | Not-subtle local shake felt by observer around 2:58 PM for about 6 seconds | Felt-only |
| OBSLocal outcome · no-shake · not official | Jun 18 · 03:33 PM | 1.0× first post-anchor observation watch | Nothing happened during the watch | Model-generated watch elapsed; no local shake outcome recorded | Elapsed |
| OBSLocal outcome · no-shake · not official | Jun 18 · 05:02 PM | 3.5× phase-sensitive observation watch | Nothing happened during the watch | Model-generated watch elapsed; no local shake outcome recorded | Elapsed |
| OBSLocal outcome · no-shake · not official | Jun 18 · 07:06 PM | 7.0× long-phase observation watch | Nothing happened during the watch | Model-generated watch elapsed; no local shake outcome recorded | Elapsed |
| OBSLocal outcome · no-shake · not official | Jun 18 · 08:35 PM | 9.5× extended-phase observation watch | Nothing happened during the watch | Latest observation outcome remains elapsed; model window generated watch, not warning | Elapsed |
| FELTLocal felt-only · unresolved · bounded official check | Jun 20 · ~02:39 AM | Separate felt-only observation | Outside confirmed event log | Subtle local shake felt by observer for about 5 seconds; bounded PHIVOLCS/public check did not find a matched official row | Unresolved |
| FELTLocal felt-only · low certainty · pattern context | Jun 26 · ~07:56 AM | 1.0× post-anchor watch | After the watch time; ~1160 min after anchor | Subtle local shake felt this morning around 7:56 AM for about 2 sec | Felt-only |
| OBSLocal outcome · no-shake · not official | Jun 26 · 01:33 PM | 9.5× extended-phase watch | Nothing happened during the watch | No local shake observed | Elapsed |
| OBSLocal outcome · no-shake · not official | Jun 26 · 01:34 PM | 9.5× extended-phase watch | Nothing happened during the watch | No local shake observed | Elapsed |
| FELTLocal felt-only · low certainty · pattern context | Jun 26 · ~07:45 PM | 9.5× extended-phase watch | After the watch time; ~33 min after anchor | Strong earthquake event felt for ~6-7 seconds for 6-7 sec | Felt-only |
| OBSLocal outcome · no-shake · not official | Jun 27 · 01:22 AM | 9.5× extended-phase watch | Nothing happened during the watch | No local shake observed | Elapsed |
| OBSLocal outcome · no-shake · not official | Jun 27 · 06:59 AM | 9.5× extended-phase watch | Nothing happened during the watch | No local shake observed | Elapsed |
| OBSLocal outcome · no-shake · not official | Jun 27 · 12:36 PM | 9.5× extended-phase watch | Nothing happened during the watch | No local shake observed | Elapsed |
| OBSLocal outcome · no-shake · not official | Jun 27 · 06:13 PM | 9.5× extended-phase watch | Nothing happened during the watch | No local shake observed | Elapsed |
| OBSLocal outcome · no-shake · not official | Jun 27 · 11:50 PM | 9.5× extended-phase watch | Nothing happened during the watch | No local shake observed | Elapsed |
| OBSLocal outcome · no-shake · not official | Jun 28 · 05:27 AM | 9.5× extended-phase watch | Nothing happened during the watch | No local shake observed | Elapsed |
| OBSLocal outcome · no-shake · not official | Jun 28 · 11:04 AM | 9.5× extended-phase watch | Nothing happened during the watch | No local shake observed | Elapsed |
| OBSLocal outcome · no-shake · not official | Jun 28 · 04:41 PM | 9.5× extended-phase watch | Nothing happened during the watch | No local shake observed | Elapsed |
| OBSLocal outcome · no-shake · not official | Jun 28 · 10:18 PM | 9.5× extended-phase watch | Nothing happened during the watch | No local shake observed | Elapsed |
| OBSLocal outcome · no-shake · not official | Jun 29 · 03:55 AM | 9.5× extended-phase watch | Nothing happened during the watch | No local shake observed | Elapsed |
| OBSLocal outcome · no-shake · not official | Jun 29 · 09:32 AM | 9.5× extended-phase watch | Nothing happened during the watch | No local shake observed | Elapsed |
| OBSLocal outcome · no-shake · not official | Jun 29 · 03:09 PM | 9.5× extended-phase watch | Nothing happened during the watch | No local shake observed | Elapsed |
| OBSLocal outcome · no-shake · not official | Jun 29 · 08:46 PM | 9.5× extended-phase watch | Nothing happened during the watch | No local shake observed | Elapsed |
| OBSLocal outcome · no-shake · not official | Jun 30 · 02:23 AM | 9.5× extended-phase watch | Nothing happened during the watch | No local shake observed | Elapsed |
Waiting for the reviewed method record.
Original selected-event least-squares value.
A wide descriptive tolerance, not a warning interval.
Chance phase coverage from the rounded 35.55-minute baseline.
Waiting for original investigation data.
35.55 minutes remains visible because it records how the investigation began. It no longer generates watches, re-anchors cycles, marks events imminent, or controls safety-facing state.
| Threshold | Events | Median spacing | Within ±12 min | Null occupancy | Descriptive p | Reading |
|---|
| Label | Displayed time · PHT | Selected interval | Nearest phase | Offset | Historical result |
|---|
The historical alignment does not establish a deterministic recurrence period, earthquake prediction capability, magnitude forecast, named controlling structure, or official sequence completeness.

Read the dashboard as a timing diary. It shows when confirmed events happened, how far apart they were, and where the current observation windows sit relative to the fitted pulse rhythm.
The main rhythm is a repeated phase-rise/reset pattern: elapsed timing accumulates, then an event or local watch outcome resets the visual index.
The labeled phase bands organize time. They do not certify that shaking will happen or how strong it will be.
Confirmed events, felt reports, and model watch windows stay separate so the chart remains useful without overstating certainty.
Rising lines mark elapsed phase accumulation. Drops mark a reset in the timing index after an observed event or local watch outcome.
Higher peaks mean longer phase intervals, not guaranteed stronger shaking. Amplitude is logged separately.
1×, 3.5×, 7×, and 9.5× organize timing around a fitted 35.5-minute pulse.
Human notes and official records stay separate, then comparable. Agreement strengthens the timing read.
These surfaces preserve how the 35.55-minute hypothesis was originally seen, explained, and communicated. They are provenance—not current sequence state, prediction evidence, or safety guidance.
Archived language and graphics may contain obsolete assumptions, selected-event reasoning, provisional tectonic attribution, or predictive framing. Their presence records the investigation; it does not validate those claims.
TSRA is an observational timing tool built from field notes, confirmed event timestamps, and a fitted phase model. Its purpose is to organize rhythm: what was confirmed, what was felt, and which watch windows are worth observing next.
Official or instrument-backed seismic records stay in the event log so the baseline remains clean.
Human reports are logged separately when timing matters but confirmation is still pending.
The model marks timing bands for observation only; it does not certify an event or estimate magnitude.
Machine transcript generated from the local M4A narration source. Active words follow the video playback time; review proper nouns against source context when needed.
Machine transcript generated from the local M4A narration source. Active words follow the video playback time; review proper nouns against source context when needed.
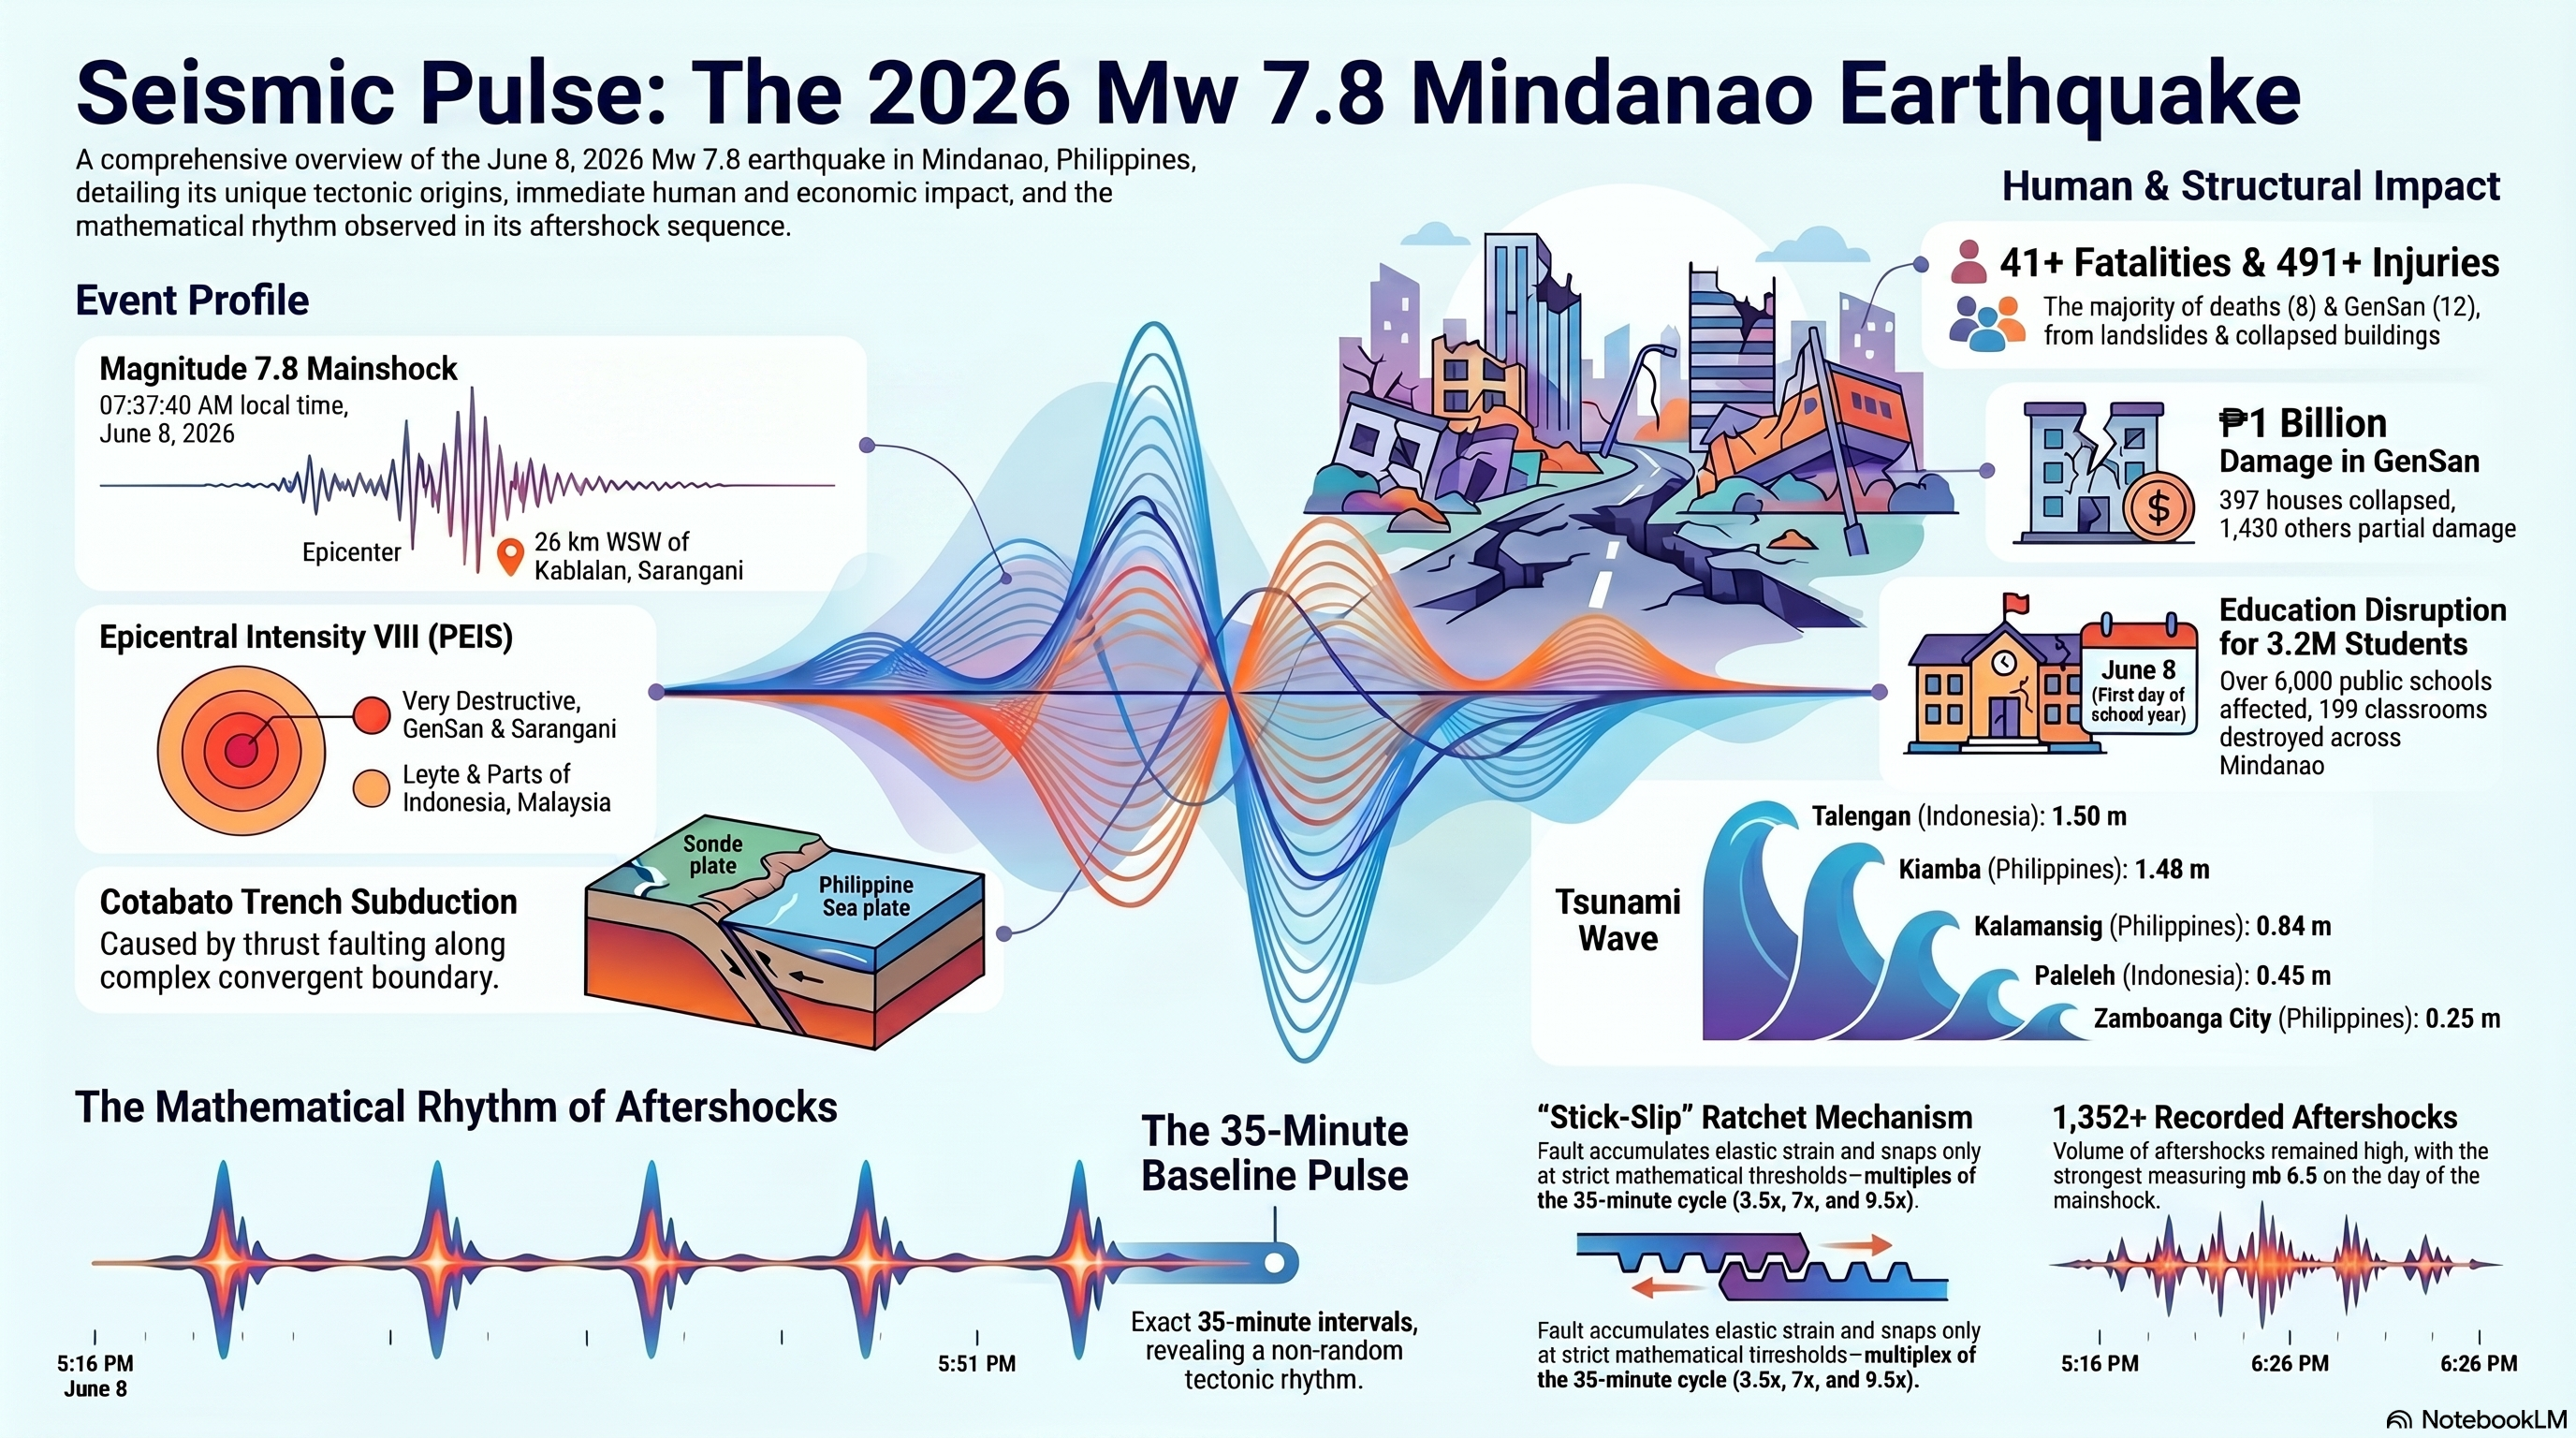
On the morning of June 8, 2026, a magnitude 7.8 earthquake struck the Cotabato Trench boundary off the southwestern coast of Mindanao. What followed was not a random scatter of aftershocks. It was a structured sequence — one that kept returning to the same timing intervals, hours apart and across two days, in a way that only a locked fault under constant pressure can produce.
The Cotabato Trench is one of the fastest-loading subduction boundaries in the Pacific region. The Celebes Sea floor dives eastward beneath Mindanao at roughly 100 millimetres every year — that is 10 centimetres of compression every 12 months, relentlessly applied to a megathrust interface that spans hundreds of kilometres.
The fault does not absorb this pressure gradually and slip away quietly. Instead, high-friction patches called asperities lock the interface in place. Elastic strain accumulates in the surrounding rock until the locking force is overcome. Then the patch snaps — a stick-slip release — and the cycle begins again from zero.
The 1918 Celebes Sea earthquake (Ms 8.3) and the 1976 Moro Gulf earthquake (Mw 8.1) both originated from this same boundary. The 2026 sequence is not an anomaly in the historical record; it is the record continuing.
After the mainshock, the aftershocks arrived at intervals that proved non-random. A3 and A4 — two consecutive events on the same afternoon — each arrived exactly 35.0 minutes after the previous event. Within 37 seconds of the fitted 35.55-minute baseline. Twice in a row.
The larger gaps held the same structure at longer range: A1 arrived 334 minutes after the mainshock (9.5× = 337.7 min, delta −3.4 min). A2 and A5 both arrived 244 minutes after their predecessors (7.0× = 248.9 min, delta −4.9 min). A6 arrived 126 minutes later (3.5× = 124.4 min, delta +1.6 min).
The system appears to discharge at discrete multiples of the base interval: 1×, 3.5×, 7×, and 9.5×. These are not values derived from a published equation. They are what the Cotabato data produced, and the fit to them is what TSRA measures.
TSRA takes the fitted 35.55-minute baseline and opens four phase windows after each confirmed event. When the next event arrives, it either lands inside a window or it does not. The model re-anchors after every confirmed hit and keeps the next set of windows open for observation.
This is not a seismic forecast in the scientific sense. There is no magnitude estimate, no rupture probability, no claim about whether a window will produce anything locally felt. The model is a timing instrument for watching whether the structural rhythm continues to hold.
During an active sequence, knowing when to look more carefully is itself useful — especially for people living close to the source zone who have no access to real-time institutional monitoring.
A7 is the honest anomaly: it arrived 28 minutes before the predicted 3.5× window. The ratchet slipped early on that cycle. The model re-anchored, and by A9 the sequence was back within 5 minutes of the 1× slot. The rhythm re-asserted itself after the perturbation — which is itself a meaningful observation about the fault’s mechanical consistency.
A10, a 10-minute sub-pulse after A9, falls outside the standard phase model entirely. Short-lag releases closely coupled to the preceding event are common in complex aftershock sequences and are not what TSRA is designed to watch for.
The model is built on 11 confirmed events across a roughly 44-hour window. That is enough to fit a baseline and open watch windows, but not enough to treat the multiplier pattern as a permanent feature of this fault’s behaviour. Two forward-looking windows on the afternoon of June 10 elapsed without a locally felt outcome, and the 09:10 PM extended-phase watch also elapsed with no local shake observed. Felt observations at ~05:14 PM and ~07:36 PM remain useful timing notes, but they are not confirmed seismic events.
TSRA does not know how much strain remains stored. It does not know whether the next window will produce surface motion strong enough to feel. It does not substitute for PHIVOLCS advisories, civil defence instructions, or professional seismological assessment. What it does is keep the timing record visible during an active sequence, in plain language, for anyone watching the ground.